
http://www1.ncdc.noaa.gov/pub/data/extremeevents/specialreports/Climate-of-1997-Global-Temp-Index-Warmest.pdf
http://www.ncdc.noaa.gov/oa/climate/research/1997/climate97.html
http://www.ncdc.noaa.gov/oa/climate/research/1997/globet3.txt
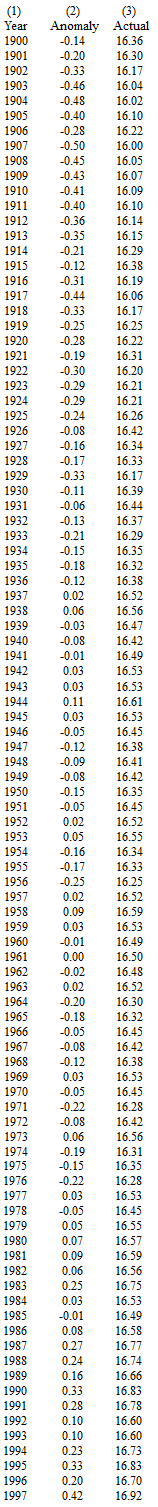
Column (1) lists the calendar years in order from 1900 to 1997.
Column (2) gives the annual global surface air temperature "anomaly" in °C for each year from 1900 to 1997, according to NOAA's document, "The climate of 1997". For example, the annual global surface air temperature "anomaly" of 1900 is -0.14°C. According to "The climate of 1997", (a) this "anomaly" for 1900 shows by how much the mean global surface air temperature of 1900 differs (+/-) from the mean global surface air temperature of the thirty calendar years from 1961 to 1990, and (b) the mean global surface air temperature of the thirty calendar years from 1961 to 1990 is 16.5°C. Therefore, the mean global surface air temperature of 1900 is, or should be, (16.5 - 0.14)°C = 16.36°C, as shown in Column (3).
Column (3) shows the results of adding 16.5°C to the "anomalies" in Column (2). Therefore, Column (3) gives the actual global surface air temperature in °C for each year from 1900 to 1997, according to "The climate of 1997". From the figures in Column (3) it is a simple matter to calculate the mean global surface air temperature for any combination of calendar years from 1900 to 1997. For example:-
(a) the mean global surface air temperature of the six calendar years from 1910 to 1915 is 16.19°C.
(b) the mean global surface air temperature of the seven calendar years from 1910 to 1916 is 16.19°C.
(b) the mean global surface air temperature of the ninety-eight years from 1900 to 1997 is 16.41°C.
(c) the mean global surface air temperature of the thirty years from 1951 to 1980 is 16.44°C.